
SLA Compliance Rate: How to Calculate It Across All Your Tickets
The SLA compliance formula, the denominator choices that change the result, a worked example by priority, and the reporting habits that keep the number honest.
Suhep Team · · 8 min read
SLA compliance rate is the share of your SLA targets that you met in a given period. It looks like one simple number, but every team that reports it is making four or five quiet decisions about what counts. Those decisions decide whether the figure tells you anything useful or just looks good on a dashboard.
This guide covers the formula, the choices that change the result, a worked example across all tickets and by priority, and the reporting habits that keep the number honest.
Quick answer
SLA compliance rate (%) = targets met ÷ (targets met + targets breached) × 100, calculated for one metric over one period.
- Measure first response and resolution separately. A ticket can meet one target and miss the other.
- Count a target once its outcome is known: met when the clock stopped in time, breached when the deadline passed, even if the ticket is still open.
- Leave out tickets that never carried an SLA, such as spam and merged duplicates, but publish how many you excluded.
- Always show the rate for each priority level next to the all-tickets figure.
What SLA compliance actually measures
An SLA target is a promise about time: a first reply within four business hours, a fix or workaround within two business days. Compliance asks how often you kept that promise. Zendesk's documentation describes an SLA policy as an agreed measure of the response and resolution times a support team delivers to its customers, and that framing helps. The unit you are counting is the promise, not the ticket.
That is why "SLA compliance for all tickets" is harder than it sounds. Most tickets carry at least two promises, one for the first response and one for resolution. Some tickets carry none at all.
The formula, and why the denominator matters
For a single metric over a reporting period, the rate is the number of targets met divided by the number of targets with a known outcome, multiplied by 100. A known outcome means the target was either met or breached.
Many guides divide by "total tickets in the period" instead. That only works if every ticket has an SLA and every clock has finished. In a live queue neither is true, so the result drifts with spam volume and with how many tickets happened to be open when you pulled the report. You end up measuring your export timing rather than your support.
Five decisions that change your number
1. Which metric you are reporting
Report first-response compliance and resolution compliance as two separate numbers. A team that replies quickly but resolves slowly will look fine on a blended score, because the strong number averages out the weak one. Two numbers make the weak spot obvious.
2. What happens to open tickets
At the end of any period some tickets are still in progress. Each target can be in one of three states:
- Met: the clock stopped before the deadline.
- Breached: the deadline passed, whether or not the ticket is now closed.
- Pending: the deadline has not arrived and the clock is still running.
Count met and breached. Leave pending out until its outcome is known, then count it in the period where its deadline fell. The common mistake is dropping every open ticket from the report. That removes the worst cases, because the ticket nobody has touched for nine days is open, and it is a breach.
3. Which tickets carry an SLA
Spam, duplicates merged into another ticket and system notifications usually should not count. Tickets with no priority are the trap. In Zendesk, for example, an SLA policy does not apply when the system Priority field is blank, even if every other condition matches. If tickets without a priority silently fall out of your report, compliance goes up as triage gets sloppier. Show the number of excluded tickets beside the rate so that drift is visible.
4. When the clock pauses
Most helpdesks let you pause an SLA clock. Atlassian's Jira Service Management documentation gives waiting for a customer to respond as the typical pause condition, and stops the measurement as soon as any finish condition is met. Pausing is fair when the customer holds the next step. It becomes a loophole when tickets are moved to a waiting status to stop the clock without actually asking the customer anything. Every so often, look at how much paused time sits on met tickets. If paused time and compliance rise together, the pause is doing the work.
5. Business hours and what counts as a response
A four-hour target means something very different in calendar hours and in business hours, so state which one applies to each priority. Then decide what stops the first-response clock. An automatic acknowledgment should not, because the customer still has not heard from anyone. An AI reply that genuinely answers the question is a different case. If you count it, report AI-answered tickets separately so you can see how much of your compliance depends on automation.
A worked example
Here is an illustrative month for a small support team. The numbers are invented to show the arithmetic. They are not a benchmark.
- 412 tickets created, 22 excluded (14 spam, 8 merged duplicates), leaving 390 tickets with an SLA.
- First response: 371 met, 13 breached, 6 pending because they arrived in the last hours of the month.
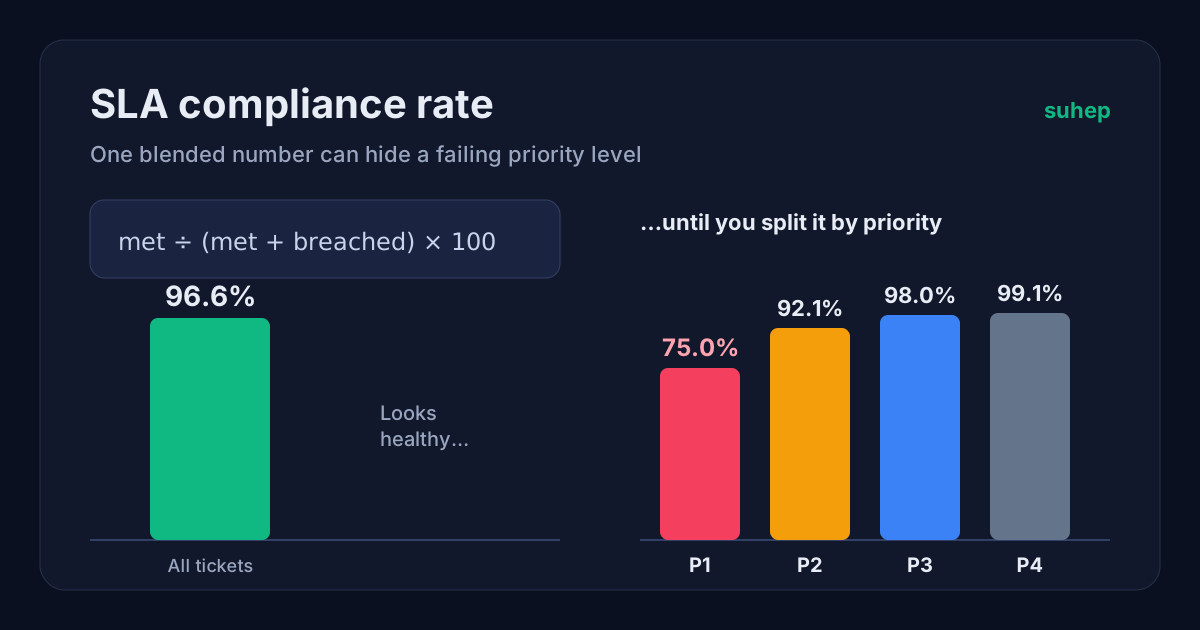
- First-response compliance: 371 ÷ (371 + 13) × 100 = 96.6%.
Now split the same results by priority:
- P1 (Urgent): 9 met, 3 breached, so 75.0%.
- P2 (High): 58 met, 5 breached, so 92.1%.
- P3 (Medium): 196 met, 4 breached, so 98.0%.
- P4 (Low): 108 met, 1 breached, so 99.1%.
The all-tickets figure of 96.6% looks healthy. The P1 line says one in four of your most serious tickets missed its first-response promise. P1 tickets are rare, so they barely move the blended number. That is the main reason never to report the all-tickets rate on its own.
For comparison, dividing by tickets created gives 371 ÷ 412 = 90.0%. Same month, same team, a different story, and one that would move every time spam volume changed.
One headline number or one per priority?
Dashboards like a single figure, and that is fine as long as it cannot hide a failing level. Two simple options work well. The first is to show the all-tickets rate with the lowest priority-level rate beside it, for example "96.6% overall, lowest P1 at 75.0%". The second is to agree a separate target for each level with whoever owns the SLA, and report each level against its own target. Avoid weighting formulas that nobody on the team can explain. If people cannot reproduce the number, they stop trusting it.
Reporting habits that keep the rate honest
- Use the same window every time, such as a calendar month or a rolling four weeks, and assign each target to the period in which its deadline fell.
- Show met, breached, pending and excluded counts, not just the percentage.
- Track near misses, meaning targets met in the final stretch of the allowed time. A rising share of near misses warns you before compliance drops.
- Review every P1 breach on its own. Group the rest by reason: wrong priority, no owner, an out-of-hours gap or waiting on another team.
- Record priority changes. A ticket that breached as P2 and was later downgraded to P3 should still count as a P2 breach.
- Decide how reopened tickets affect resolution targets. Helpdesks handle this differently, and Zendesk's SLA documentation has a section on how reopening changes a ticket's targets.
Mistakes that inflate compliance
- Closing tickets to stop the clock, then reopening them.
- Counting automatic acknowledgments as first responses.
- Leaving breached tickets out of the report because they are still open.
- Letting tickets without a priority fall out of the calculation.
- Changing targets mid-period without restating the earlier figures.
None of these need bad intent. They usually come from a report built once and never questioned. A short written definition of how your team calculates compliance, kept next to the dashboard, prevents most of them.
Setting this up in Suhep
In Suhep's SLA settings you set a first-response target and a resolution target for each of the four priorities, Urgent, High, Medium and Low. You choose whether each clock runs during business hours only or around the clock, and you set a warning threshold so tickets nearing a breach are flagged before the target is missed. The dashboard lists tickets at risk of breaching, which is where near misses show up while there is still time to act.
If you are still defining the levels themselves, start with our guide to P1 to P4 ticket priority levels and SLA targets and the help article on ticket priorities and SLA. The overview of customer support SLA management explains how tracking and escalation fit together, and plans are listed on the pricing page.
Frequently asked questions
What is a good SLA compliance rate?
There is no universal benchmark, because the rate depends on how demanding your targets are. Agree a target for each priority level and judge each level against it. If compliance is close to 100% but customers still complain about waiting, your targets are probably too generous.
Should open tickets count towards SLA compliance?
Count an open ticket as soon as its target is breached. If the deadline has not arrived yet, leave it out and count it in the period where its deadline falls.
Is response compliance the same as resolution compliance?
No. They measure different promises and should be reported separately. A team can answer quickly and still resolve slowly.
Does pausing the SLA clock affect compliance?
Yes. Paused time does not count against the target, so pausing while you genuinely wait for the customer is fair. Pausing without asking the customer anything inflates the rate.